Year: 2023
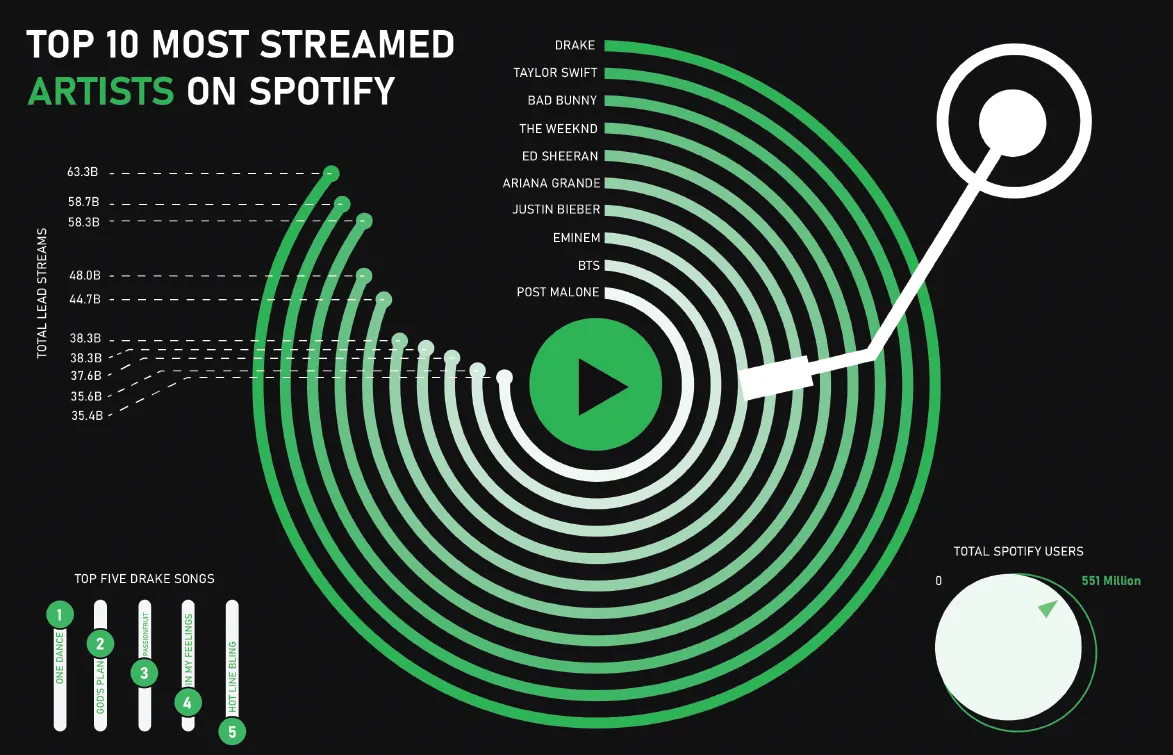
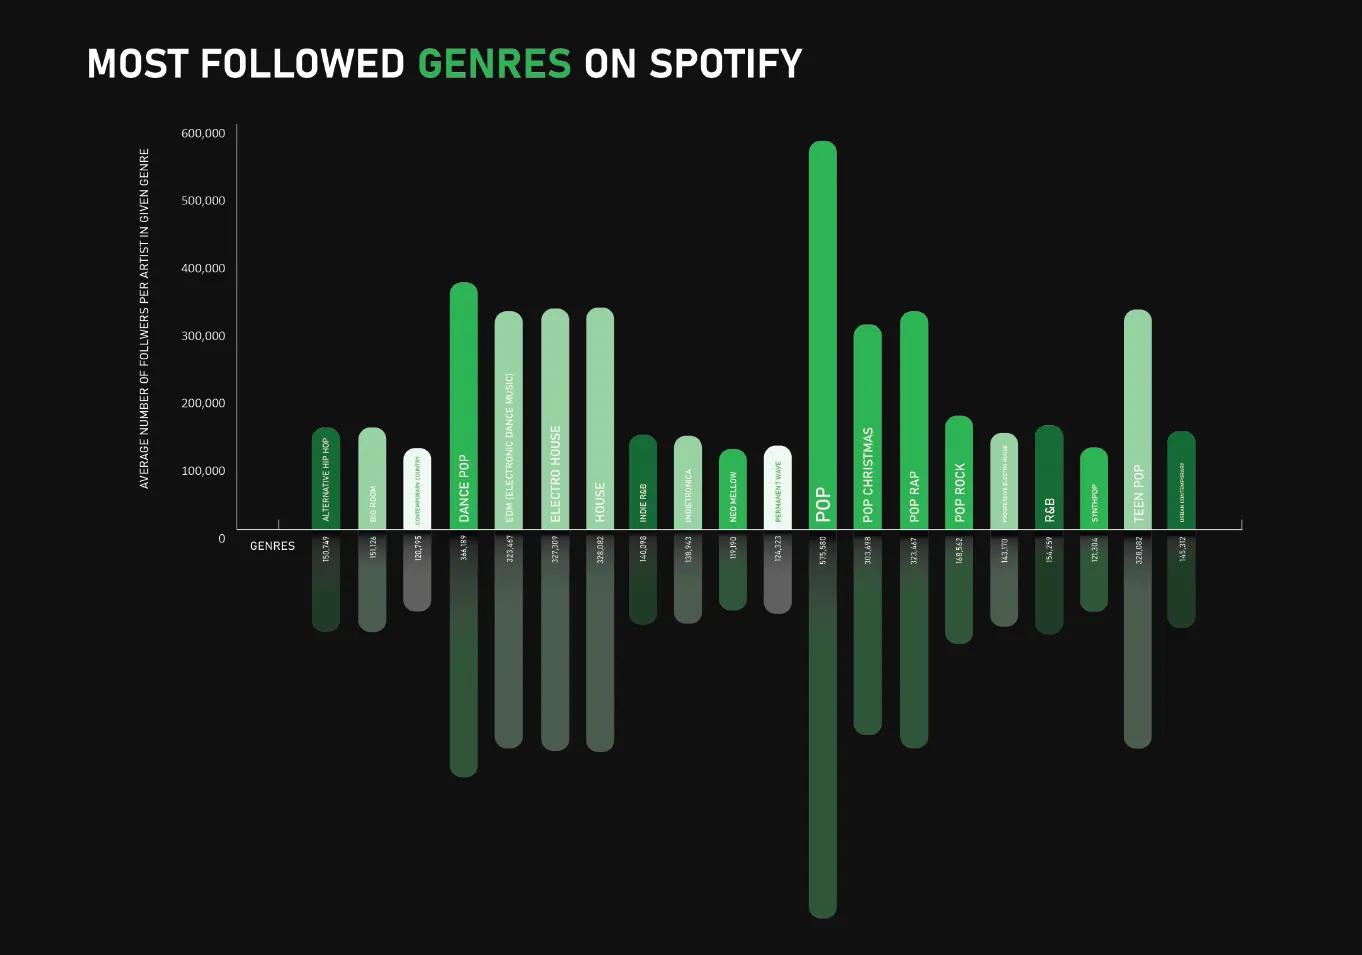
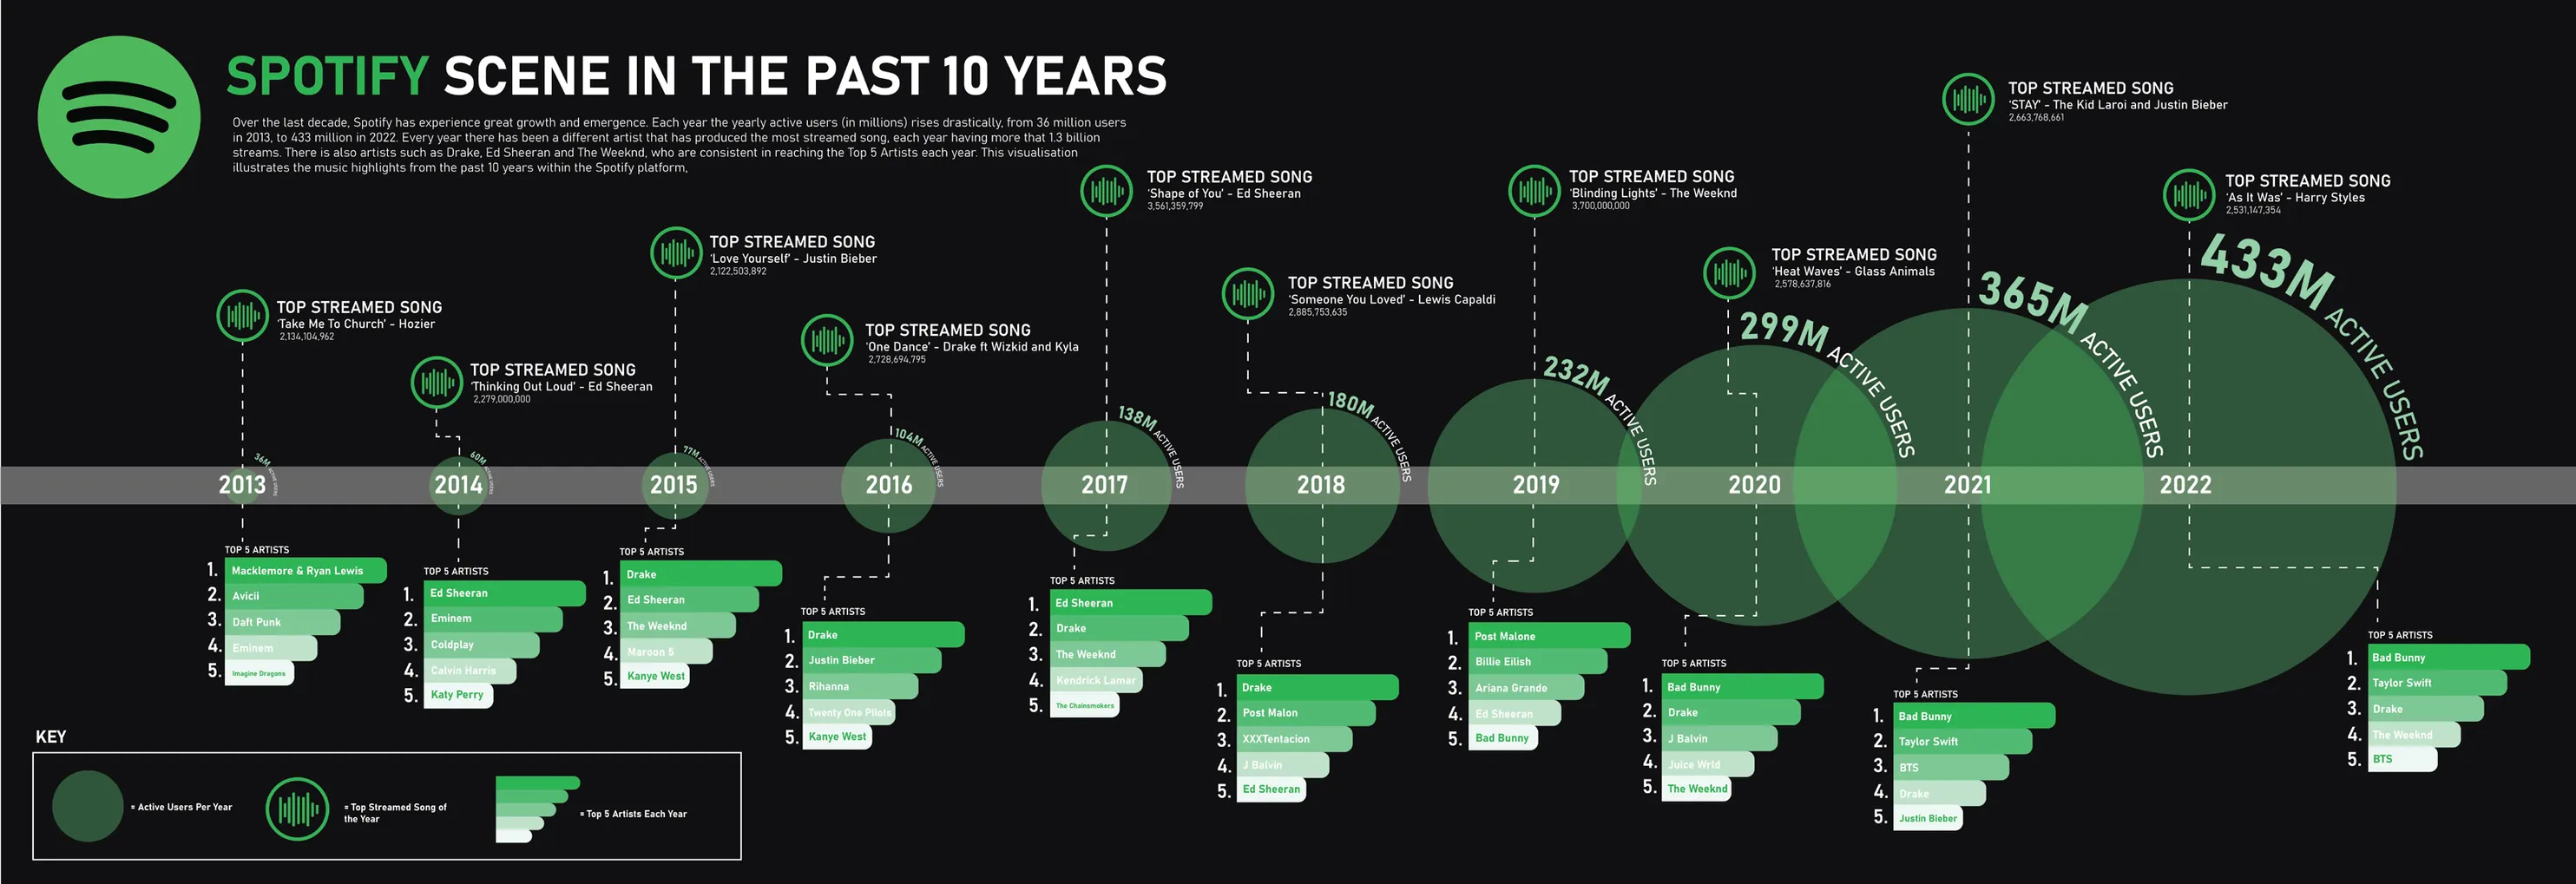
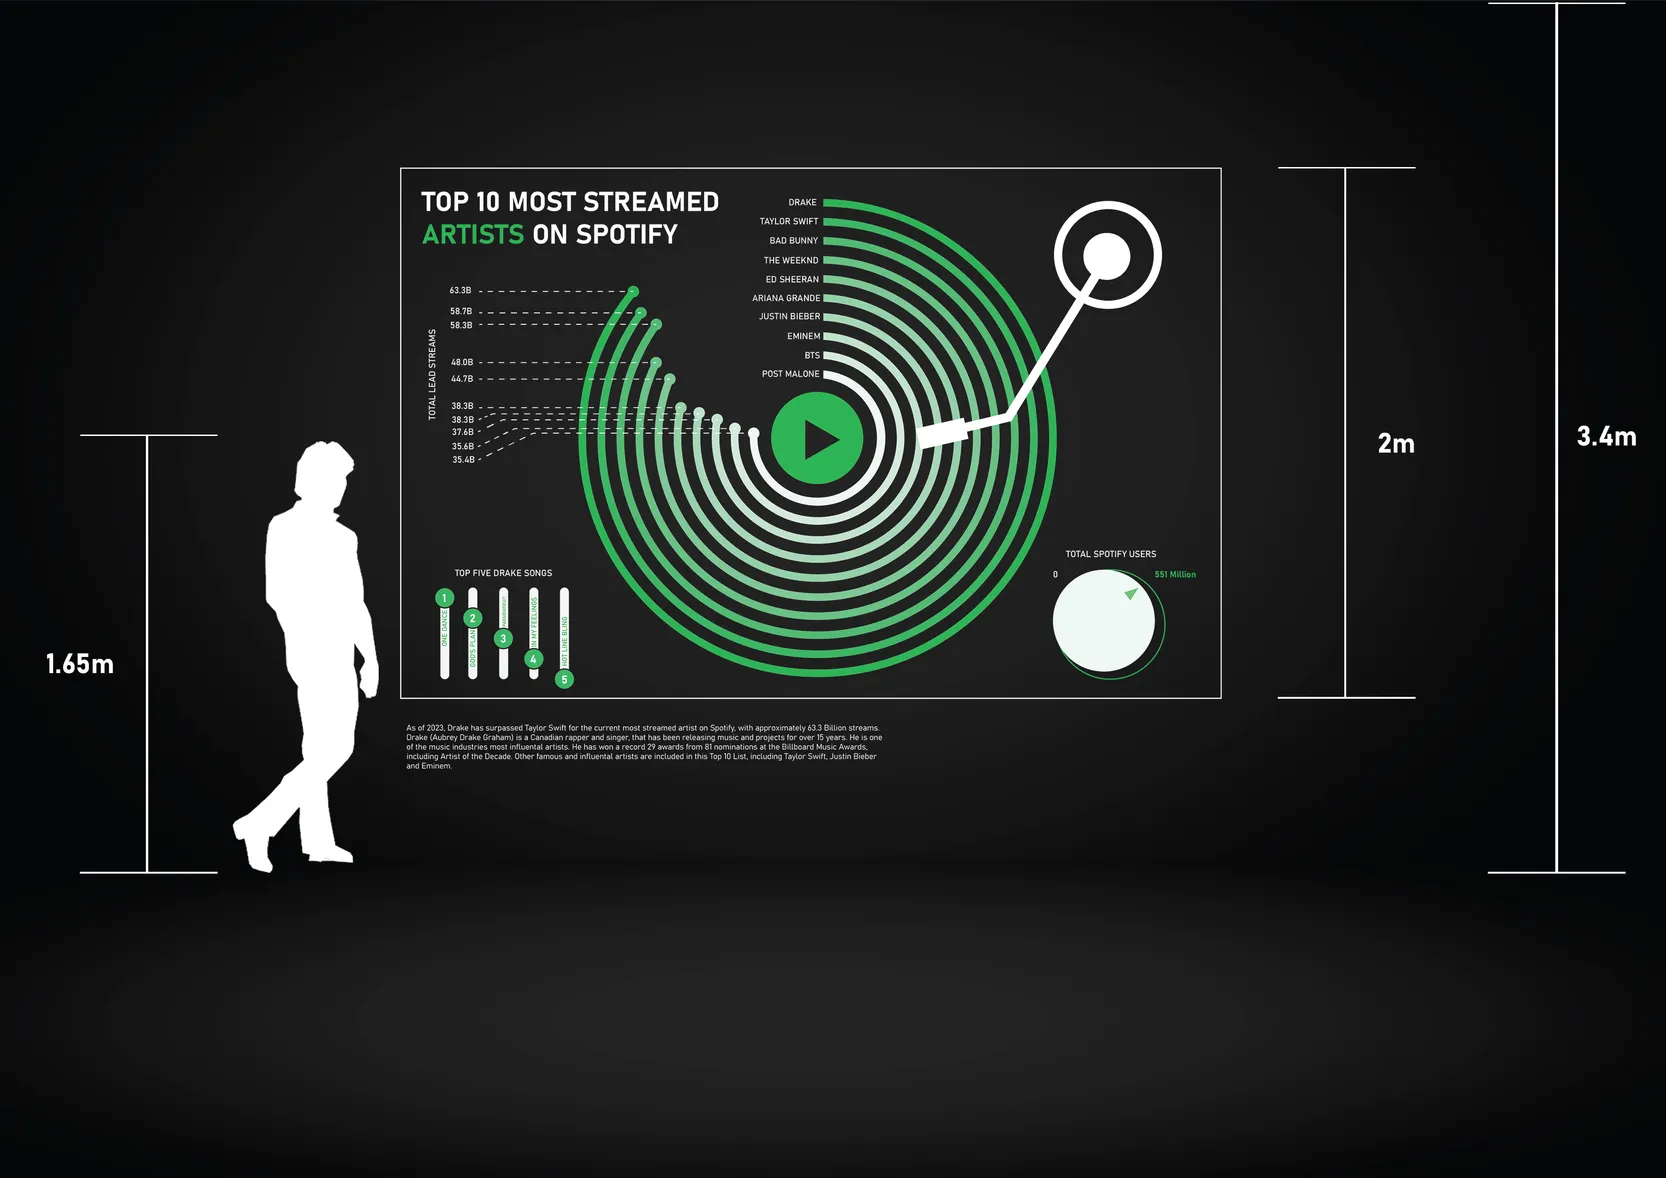
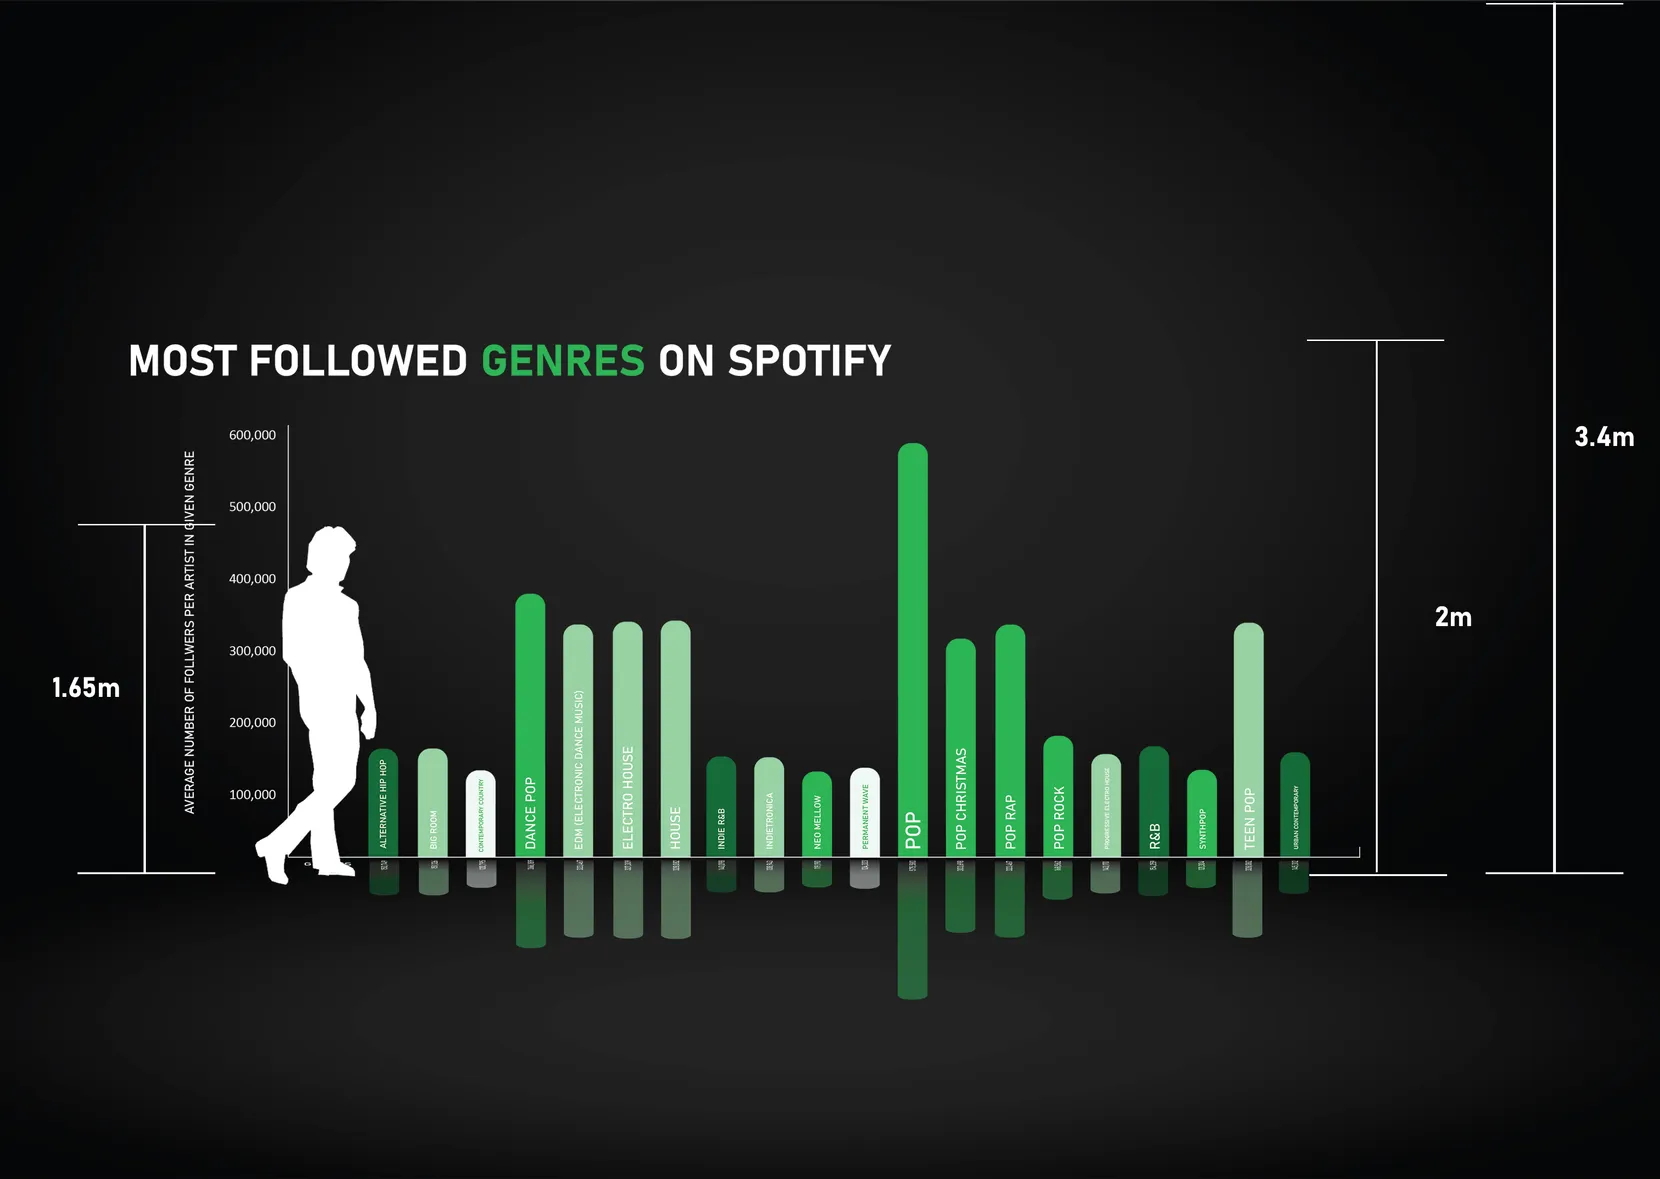
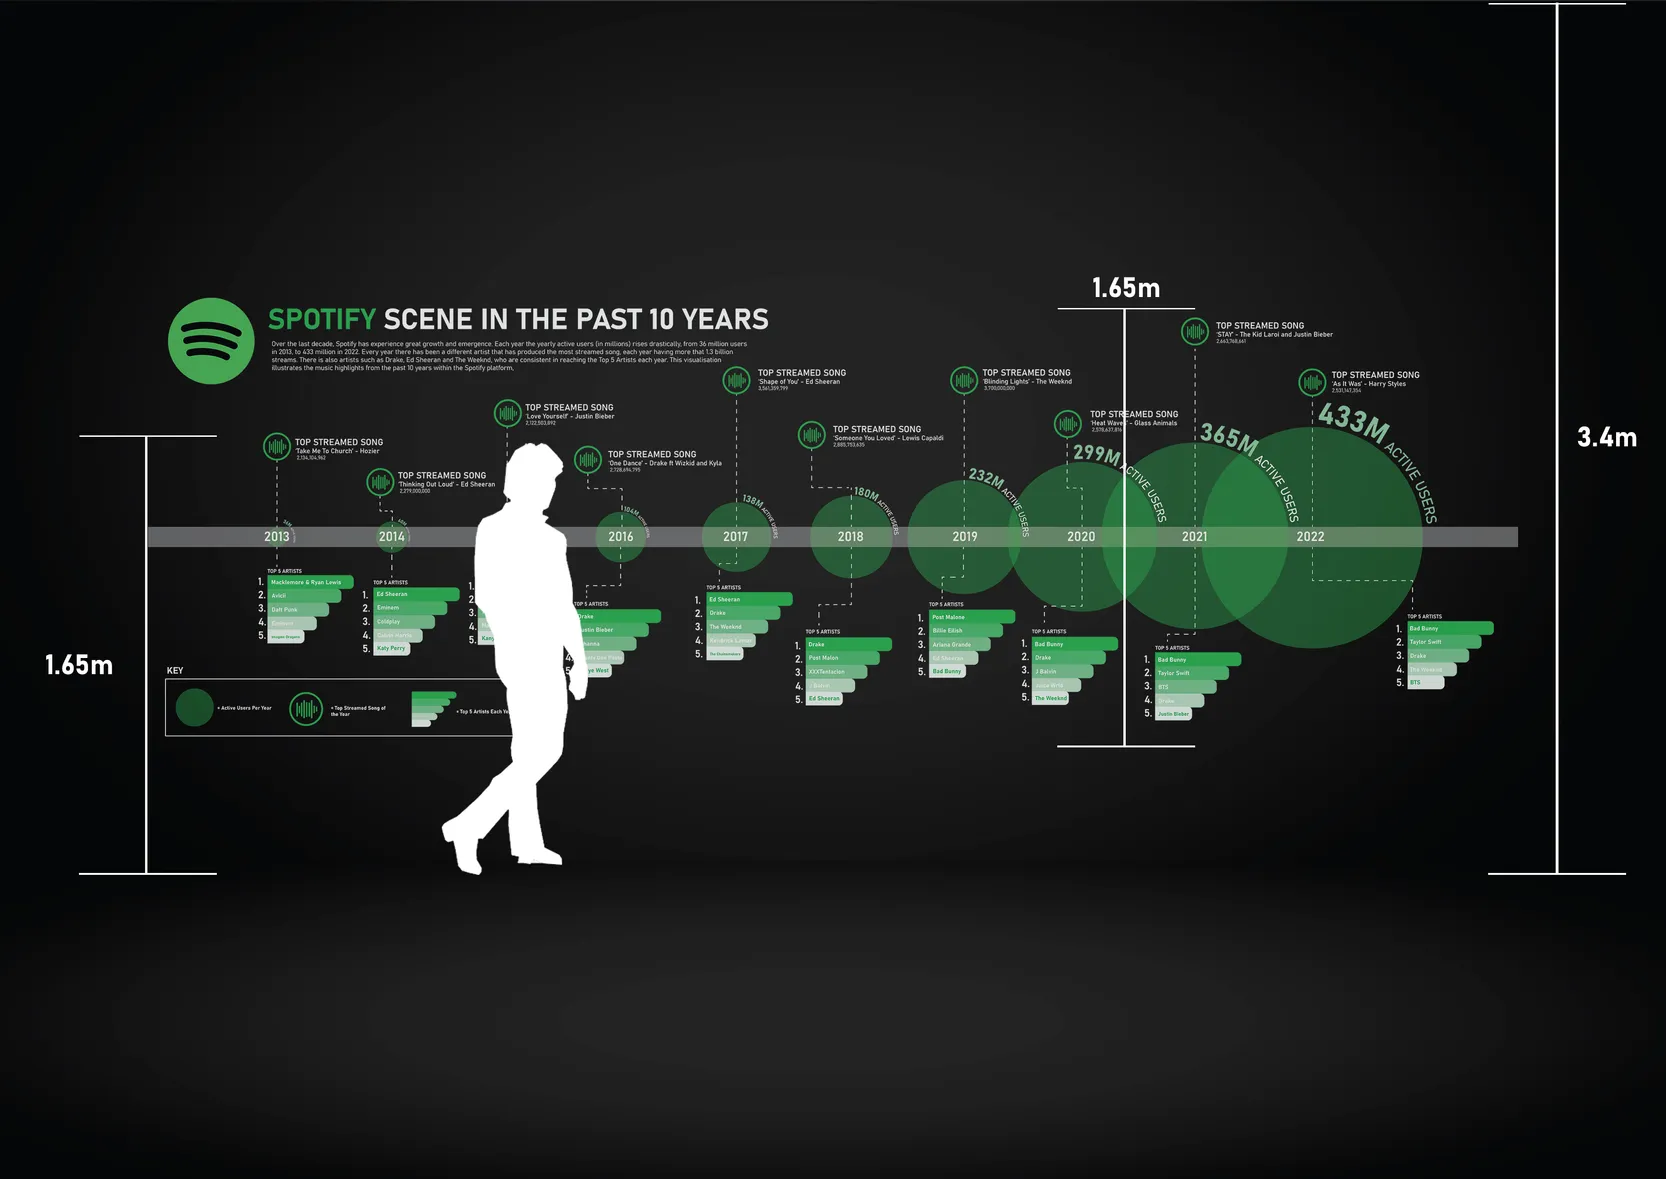
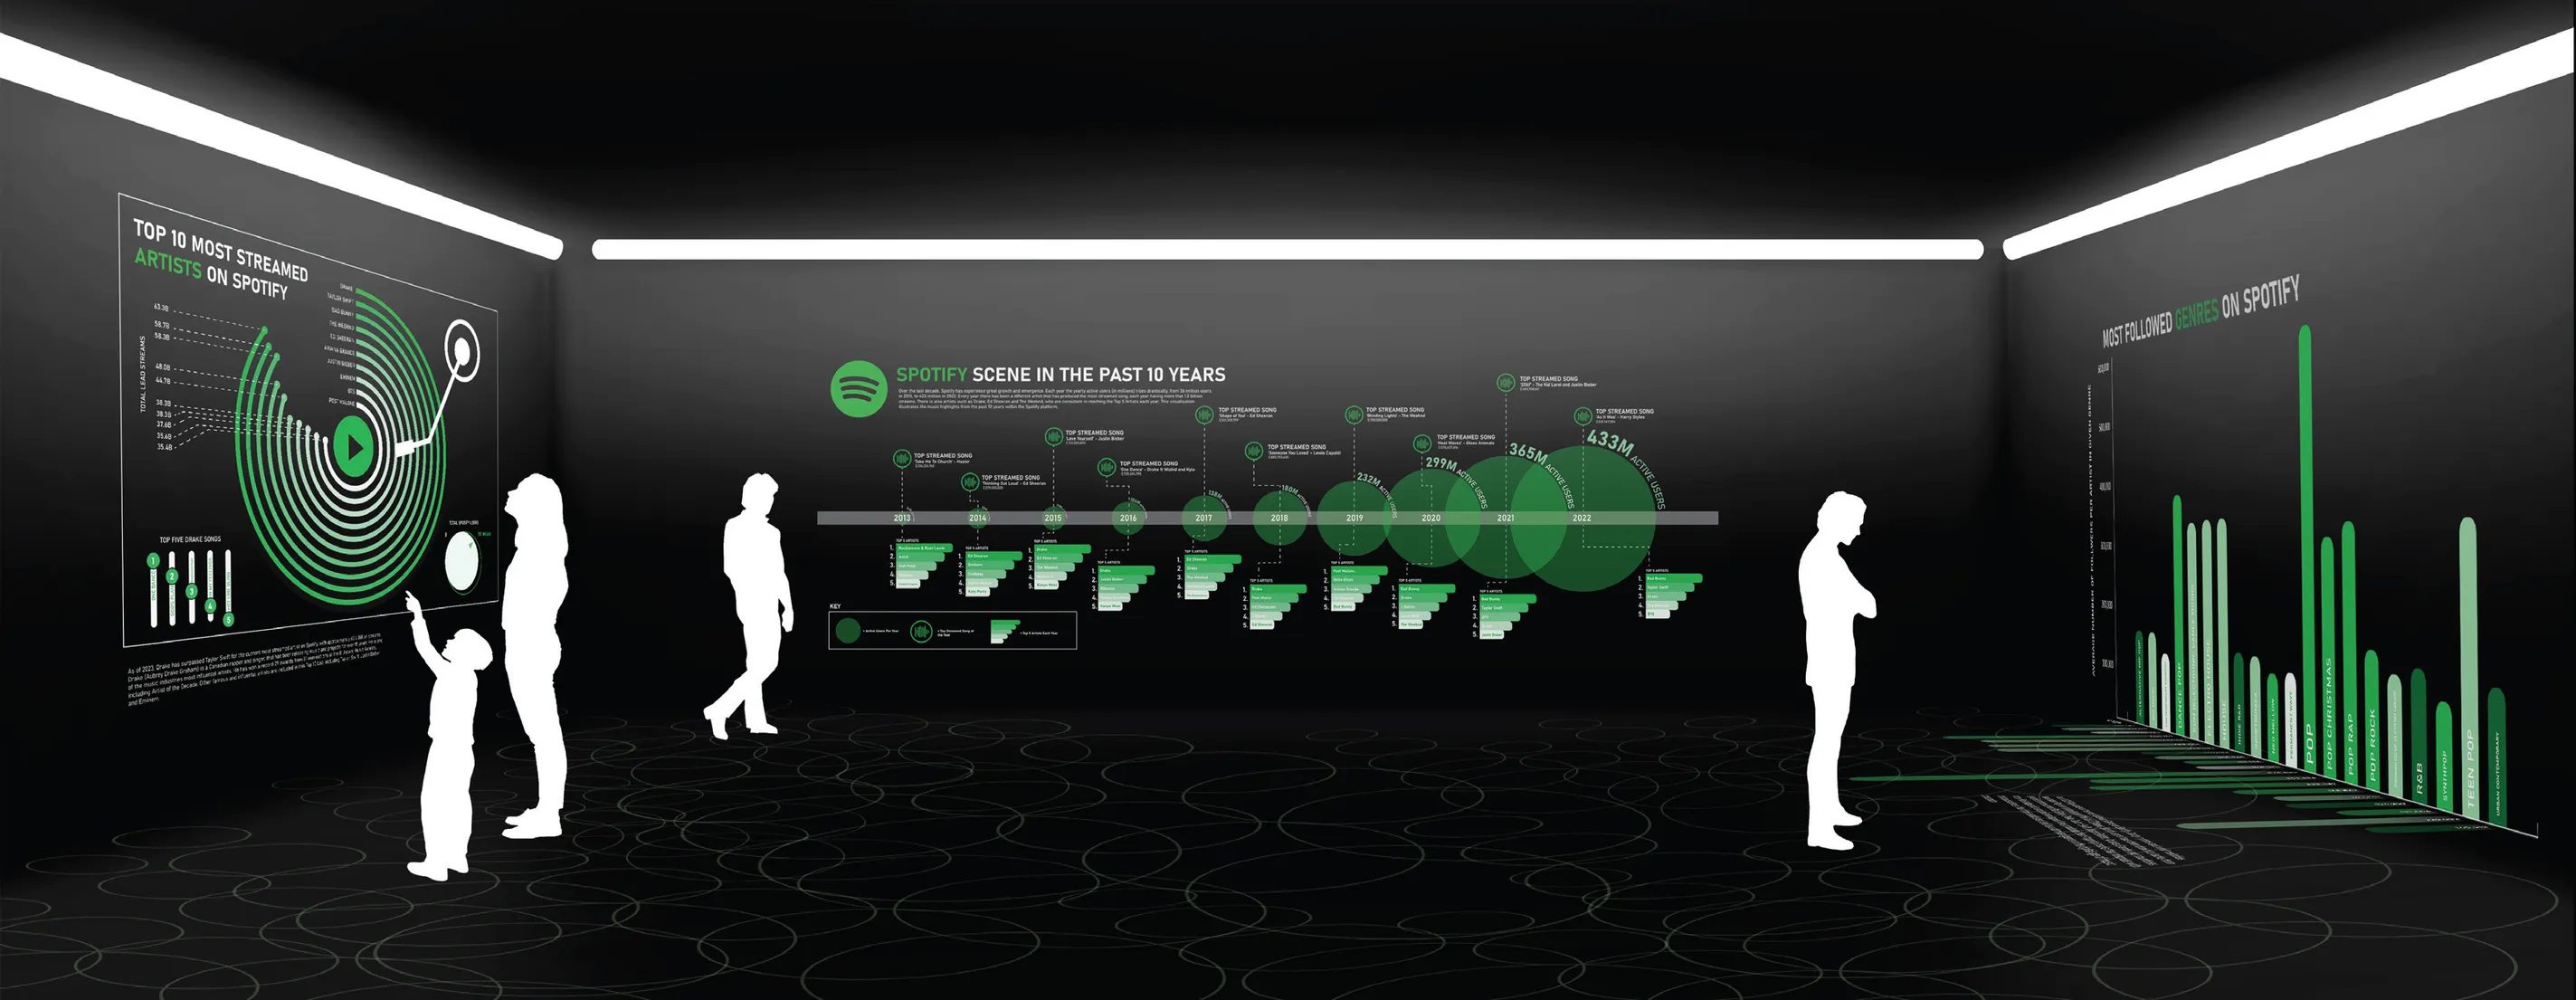
Description: This project has gathered Spotify stats, analytics and trends such as 'Top Genres', 'Top Streamed Artists', 'Top Songs' and 'Active Users' and has converted into graphic data visualisations. These univariate (one variable) and multivariate (more than two variables) visualisations aim to present complex data analytics into a more visually engaging and digestive graphic. These visualisations would propose to be projected and displayed within exhibition spaces.
Tools:


Click any photo to view in fullscreen.